Crac'h Airbnb Market Analysis 2025: Short Term Rental Data & Vacation Rental Statistics in Brittany, France
Is Airbnb profitable in Crac'h in 2025? Explore comprehensive Airbnb analytics for Crac'h, Brittany, France to uncover income potential. This 2025 STR market report for Crac'h, based on AirROI data from April 2024 to March 2025, reveals key trends in the niche market of 91 active listings.
Whether you're considering an Airbnb investment in Crac'h, optimizing your existing vacation rental, or exploring rental arbitrage opportunities, understanding the Crac'h Airbnb data is crucial. Leveraging the low regulation environment is key to maximizing your short term rental income potential. Let's dive into the specifics.
Key Crac'h Airbnb Performance Metrics Overview
Monthly Airbnb Revenue Variations & Income Potential in Crac'h (2025)
Understanding the monthly revenue variations for Airbnb listings in Crac'h is key to maximizing your short term rental income potential. Seasonality significantly impacts earnings. Our analysis, based on data from the past 12 months, shows that the peak revenue month for STRs in Crac'h is typically August, while March often presents the lowest earnings, highlighting opportunities for strategic pricing adjustments during shoulder and low seasons. Explore the typical Airbnb income in Crac'h across different performance tiers:
- Best-in-class properties (Top 10%) achieve $4,790+ monthly, often utilizing dynamic pricing and superior guest experiences.
- Strong performing properties (Top 25%) earn $2,825 or more, indicating effective management and desirable locations/amenities.
- Typical properties (Median) generate around $1,482 per month, representing the average market performance.
- Entry-level properties (Bottom 25%) see earnings around $711, often with potential for optimization.
Average Monthly Airbnb Earnings Trend in Crac'h
Crac'h Airbnb Occupancy Rate Trends (2025)
Maximize your bookings by understanding the Crac'h STR occupancy trends. Seasonal demand shifts significantly influence how often properties are booked. Typically, Augustsees the highest demand (peak season occupancy), while January experiences the lowest (low season). Effective strategies, like adjusting minimum stays or offering promotions, can boost occupancy during slower periods. Here's how different property tiers perform in Crac'h:
- Best-in-class properties (Top 10%) achieve 78%+ occupancy, indicating high desirability and potentially optimized availability.
- Strong performing properties (Top 25%) maintain 59% or higher occupancy, suggesting good market fit and guest satisfaction.
- Typical properties (Median) have an occupancy rate around 37%.
- Entry-level properties (Bottom 25%) average 20% occupancy, potentially facing higher vacancy.
Average Monthly Occupancy Rate Trend in Crac'h
Average Daily Rate (ADR) Airbnb Trends in Crac'h (2025)
Effective short term rental pricing strategy in Crac'h involves understanding monthly ADR fluctuations. The Average Daily Rate (ADR) for Airbnb in Crac'h typically peaks in July and dips lowest during April. Leveraging Airbnb dynamic pricing tools or strategies based on this seasonality can significantly boost revenue. Here's a look at the typical nightly rates achieved:
- Best-in-class properties (Top 10%) command rates of $295+ per night, often due to premium features or locations.
- Strong performing properties (Top 25%) achieve nightly rates of $205 or more.
- Typical properties (Median) charge around $120 per night.
- Entry-level properties (Bottom 25%) earn around $80 per night.
Average Daily Rate (ADR) Trend by Month in Crac'h
Get Live Crac'h Market Intelligence 👇

Explore Real-time Analytics
Airbnb Seasonality Analysis & Trends in Crac'h (2025)
Peak Season (August, July, May)
- Revenue averages $3,315 per month
- Occupancy rates average 57.5%
- Daily rates average $163
Shoulder Season
- Revenue averages $2,009 per month
- Occupancy maintains around 37.8%
- Daily rates hold near $159
Low Season (January, February, March)
- Revenue drops to average $1,124 per month
- Occupancy decreases to average 29.0%
- Daily rates adjust to average $158
Seasonality Insights for Crac'h
- The Airbnb seasonality in Crac'h shows highly seasonal trends requiring careful strategy. While the sections above show seasonal averages, it's also insightful to look at the extremes:
- During the high season, the absolute peak month showcases Crac'h's highest earning potential, with monthly revenues capable of climbing to $4,199, occupancy reaching a high of 71.8%, and ADRs peaking at $166.
- Conversely, the slowest single month of the year, typically falling within the low season, marks the market's lowest point. In this month, revenue might dip to $994, occupancy could drop to 25.8%, and ADRs may adjust down to $154.
- Understanding both the seasonal averages and these monthly peaks and troughs in revenue, occupancy, and ADR is crucial for maximizing your Airbnb profit potential in Crac'h.
Seasonal Strategies for Maximizing Profit
- Peak Season: Maximize revenue through premium pricing and potentially longer minimum stays. Ensure high availability.
- Low Season: Offer competitive pricing, special promotions (e.g., extended stay discounts), and flexible cancellation policies. Target off-season travelers like remote workers or budget-conscious guests.
- Shoulder Seasons: Implement dynamic pricing that balances peak and low rates. Target weekend travelers or specific events. Offer slightly more flexible terms than peak season.
- Regularly analyze your own performance against these Crac'h seasonality benchmarks and adjust your pricing and availability strategy accordingly.
Best Areas for Airbnb Investment in Crac'h (2025)
Exploring the top neighborhoods for short-term rentals in Crac'h? This section highlights key areas, outlining why they are attractive for hosts and guests, along with notable local attractions. Consider these locations based on your target guest profile and investment strategy.
| Neighborhood / Area | Why Host Here? (Target Guests & Appeal) | Key Attractions & Landmarks |
|---|---|---|
| Port Crach | A charming port area known for its picturesque harbor and stunning views. It's an ideal spot for tourists looking to enjoy water activities and local seafood. | Le Port de Crach, Crach Beach, Marais de Suscinio, Port Haliguen, Sailing and boat tours |
| Erdeven Beaches | Beautiful sandy beaches that attract families and sun-seekers during the summer months. This area is perfect for beach lovers and those looking to relax by the sea. | Erdeven Beach, Kerminihy Beach, Kerhillio Beach, Windurfing and Kitesurfing spots, Coastal walking paths |
| Carnac Alignments | Famous for its prehistoric stone alignments, this area draws history enthusiasts and tourists interested in cultural heritage. A great spot for both education and exploration. | Carnac Stones, Menec Alignments, Museum of Prehistory, Local restaurants & cafés, Carnac Beach |
| Locmariaquer | Known for its historical sites and natural beauty, this area offers a unique blend of culture and relaxation, attracting visitors interested in both history and nature. | Locmariaquer Megaliths, Port de Locmariaquer, Megalithic sites, Beaches and coastline, Local seafood dining |
| Quiberon Peninsula | A well-known tourist destination famed for its rugged coastline and scenic beauty. Offers numerous outdoor activities like hiking and sailing, appealing to adventure seekers. | Quiberon Beach, Pointe de Conguel, Wild coast hiking trails, Local markets, Diverse marine activities |
| Auray | A historical town with a beautiful harbor, known for its quaint streets and vibrant market. It's attractive for those looking for a local experience close to the coast. | Auray Port, Place du Poids Public, St. Goustan, Weekly markets, Historic architecture |
| Belle-Île-en-Mer | A stunning island destination with breathtaking landscapes and tranquil beaches, perfect for tourists looking to escape. This area offers a variety of activities and serene nature. | Porte de la Mer, Beaches of Belle-Île, Hiking trails, Local art galleries, Scenic viewpoints |
| Vannes | A lively city with a rich history and access to the Gulf of Morbihan. Attracts tourists for its cultural heritage, shops, and delightful coastal scenery. | Vannes Old Town, Gulf of Morbihan, Château de l'Hermine, Daily markets, Local cuisine specialties |
Understanding Airbnb License Requirements & STR Laws in Crac'h (2025)
While Crac'h, Brittany, France currently shows low STR regulations, specific Airbnb license requirements might still exist or change. Always verify the latest short term rental regulations and Airbnb license requirements directly with local government authorities for Crac'h to ensure full compliance before hosting.
(Source: AirROI data, 2025, based on 7% licensed listings)
Top Performing Airbnb Properties in Crac'h (2025)
Benchmark your potential! Explore examples of top-performing Airbnb properties in Crac'hbased on Trailing Twelve Month (TTM) revenue. Analyze their characteristics, revenue, occupancy rate, and ADR to understand what drives success in this market.
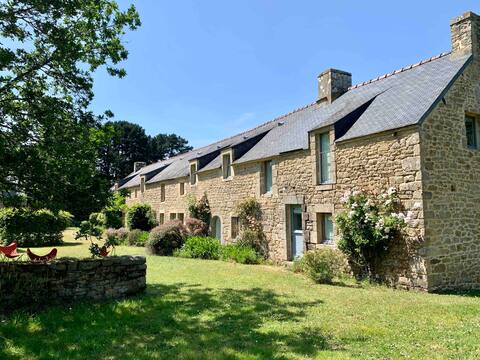
Large family home close to the beaches
Entire Place • 5 bedrooms

Exceptional site on the edge of the Gulf of Morbihan
Entire Place • 7 bedrooms
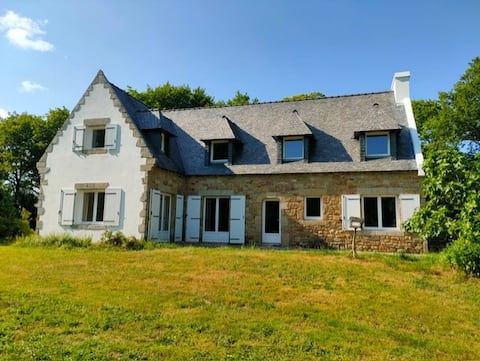
Big quiet home Crac'h
Entire Place • 6 bedrooms

Location d’une île privée - Refuge en bord de mer
Entire Place • 5 bedrooms
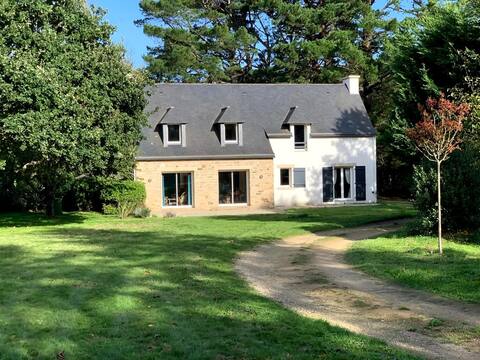
Big cozy and family home in Crach
Entire Place • 6 bedrooms
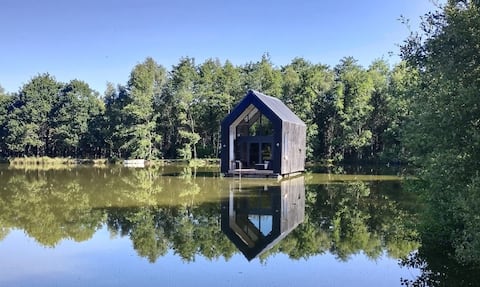
Hermione Unusual cabin on the water, Crach Morbihan
Entire Place • 1 bedroom
Note: Performance varies based on location, size, amenities, seasonality, and management quality. Data reflects the past 12 months.
Top Performing Airbnb Hosts in Crac'h (2025)
Learn from the best! This table showcases top-performing Airbnb hosts in Crac'h based on the number of properties managed and estimated total revenue over the past year. Analyze their scale and performance metrics.
| Host Name | Properties | Grossing Revenue | Stay Reviews | Avg Rating |
|---|---|---|---|---|
| Annabelle | 1 | $76,226 | 18 | 4.94/5.0 |
| Philippe | 2 | $75,951 | 527 | 4.99/5.0 |
| Cécile | 1 | $74,850 | 142 | 4.82/5.0 |
| Astrid | 1 | $60,693 | 6 | 5.00/5.0 |
| Host #12839494 | 1 | $60,296 | 2 | 0.00/5.0 |
| Ludovic | 1 | $44,855 | 17 | 4.59/5.0 |
| Ronan | 1 | $36,145 | 5 | 5.00/5.0 |
| Maryvonne | 1 | $35,883 | 39 | 4.97/5.0 |
| Romain | 1 | $35,687 | 31 | 4.74/5.0 |
| Caroline | 1 | $35,015 | 5 | 4.60/5.0 |
Analyzing the strategies of top hosts, such as their property selection, pricing, and guest communication, can offer valuable lessons for optimizing your own Airbnb operations in Crac'h.
Dive Deeper: Advanced Crac'h STR Market Data (2025)
Ready to unlock more insights? AirROI provides access to advanced metrics and comprehensive Airbnb data for Crac'h. Explore detailed analytics beyond this report to refine your investment strategy, optimize pricing, and maximize your vacation rental profits.
Explore Advanced MetricsCrac'h Short-Term Rental Market Composition (2025): Property & Room Types
Room Type Distribution
Property Type Distribution
Market Composition Insights for Crac'h
- The Crac'h Airbnb market composition is heavily skewed towards Entire Home/Apt listings, which make up 87.9% of the 91 active rentals. This indicates strong guest preference for privacy and space.
- Looking at the property type distribution in Crac'h, House properties are the most common (67%), reflecting the local real estate landscape.
- Houses represent a significant 67% portion, catering likely to families or larger groups.
- The presence of 11% Hotel/Boutique listings indicates integration with traditional hospitality.
- Smaller segments like others, outdoor/unique, unique stays (combined 7.7%) offer potential for unique stay experiences.
Crac'h Airbnb Room Capacity Analysis (2025): Bedroom Distribution
Distribution of Listings by Number of Bedrooms
Room Capacity Insights for Crac'h
- The dominant room capacity in Crac'h is 3 bedrooms listings, making up 24.2% of the market. This suggests a strong demand for properties suitable for families or small groups.
- Together, 3 bedrooms and 4 bedrooms properties represent 42.9% of the active Airbnb listings in Crac'h, indicating a high concentration in these sizes.
- A significant 58.3% of listings offer 3+ bedrooms, catering to larger groups and families seeking more space in Crac'h.
Crac'h Vacation Rental Guest Capacity Trends (2025)
Distribution of Listings by Guest Capacity
Guest Capacity Insights for Crac'h
- The most common guest capacity trend in Crac'h vacation rentals is listings accommodating 8+ guests (33%). This suggests the primary traveler segment is likely larger groups.
- Properties designed for 8+ guests and 6 guests dominate the Crac'h STR market, accounting for 51.7% of listings.
- 51.7% of properties accommodate 6+ guests, serving the market segment for larger families or group travel in Crac'h.
- On average, properties in Crac'h are equipped to host 5.0 guests.
Crac'h Airbnb Booking Patterns (2025): Available vs. Booked Days
Available Days Distribution
Booked Days Distribution
Booking Pattern Insights for Crac'h
- The most common availability pattern in Crac'h falls within the 271-366 days range, representing 58.2% of listings. This suggests many properties have significant open periods on their calendars.
- Approximately 84.6% of listings show high availability (181+ days open annually), indicating potential for increased bookings or specific owner usage patterns.
- For booked days, the 31-90 days range is most frequent in Crac'h (35.2%), reflecting common guest stay durations or potential owner blocking patterns.
- A notable 16.5% of properties secure long booking periods (181+ days booked per year), highlighting successful long-term rental strategies or significant owner usage.
Crac'h Airbnb Minimum Stay Requirements Analysis
Distribution of Listings by Minimum Night Requirement
1 Night
19 listings
21.6% of total
2 Nights
22 listings
25% of total
3 Nights
11 listings
12.5% of total
4-6 Nights
17 listings
19.3% of total
7-29 Nights
12 listings
13.6% of total
30+ Nights
7 listings
8% of total
Key Insights
- The most prevalent minimum stay requirement in Crac'h is 2 Nights, adopted by 25% of listings. This highlights the market's preference for shorter, flexible bookings.
Recommendations
- Align with the market by considering a 2 Nights minimum stay, as 25% of Crac'h hosts use this setting.
- If feasible, allowing 1-night stays, especially midweek or during low season, could capture last-minute bookings, as only 21.6% currently do.
- Explore offering discounts for stays of 30+ nights to attract the 8% of the market seeking extended stays.
- Adjust minimum nights based on seasonality – potentially shorter during low season and longer during peak demand periods in Crac'h.
Crac'h Airbnb Cancellation Policy Trends Analysis (2025)
Super Strict 30 Days
1 listings
1.3% of total
Flexible
21 listings
28% of total
Moderate
16 listings
21.3% of total
Firm
18 listings
24% of total
Strict
19 listings
25.3% of total
Cancellation Policy Insights for Crac'h
- The prevailing Airbnb cancellation policy trend in Crac'h is Flexible, used by 28% of listings.
- There's a relatively balanced mix between guest-friendly (49.3%) and stricter (49.3%) policies, offering choices for different guest needs.
Recommendations for Hosts
- Consider adopting a Flexible policy to align with the 28% market standard in Crac'h.
- Regularly review your cancellation policy against competitors and market demand shifts in Crac'h.
Crac'h STR Booking Lead Time Analysis (2025)
Average Booking Lead Time by Month
Booking Lead Time Insights for Crac'h
- The overall average booking lead time for vacation rentals in Crac'h is 52 days.
- Guests book furthest in advance for stays during May (average 85 days), likely coinciding with peak travel demand or local events.
- The shortest booking windows occur for stays in November (average 29 days), indicating more last-minute travel plans during this time.
- Seasonally, Summer (79 days avg.) sees the longest lead times, while Fall (42 days avg.) has the shortest, reflecting typical travel planning cycles.
Recommendations for Hosts
- Use the overall average lead time (52 days) as a baseline for your pricing and availability strategy in Crac'h.
- For May stays, consider implementing length-of-stay discounts or slightly higher rates for bookings made less than 85 days out to capitalize on advance planning.
- Target marketing efforts for the Summer season well in advance (at least 79 days) to capture early planners.
- Monitor your own booking lead times against these Crac'h averages to identify opportunities for dynamic pricing adjustments.
Popular & Essential Airbnb Amenities in Crac'h (2025)
Amenity Prevalence
Amenity Insights for Crac'h
- Popular amenities like Free parking on premises, Hot water, Kitchen are common but not universal. Offering these can provide a competitive edge.
- Warning: Wifi is not universally provided but is considered essential globally. Ensure reliable Wifi is offered.
Recommendations for Hosts
- Consider adding popular differentiators like Free parking on premises or Hot water to increase appeal.
- Highlight unique or less common amenities you offer (e.g., hot tub, dedicated workspace, EV charger) in your listing description and photos.
- Regularly check competitor amenities in Crac'h to stay competitive.
Crac'h Airbnb Guest Demographics & Profile Analysis (2025)
Guest Profile Summary for Crac'h
- The typical guest profile for Airbnb in Crac'h consists of primarily domestic travelers (89%), often arriving from nearby Paris, typically belonging to the Post-2000s (Gen Z/Alpha) group (50%), primarily speaking French or English.
- Domestic travelers account for 88.6% of guests.
- Key international markets include France (88.6%) and United Kingdom (2.3%).
- Top languages spoken are French (46%) followed by English (34.2%).
- A significant demographic segment is the Post-2000s (Gen Z/Alpha) group, representing 50% of guests.
Recommendations for Hosts
- Target domestic marketing efforts towards travelers from Paris and Nantes.
- Tailor amenities and listing descriptions to appeal to the dominant Post-2000s (Gen Z/Alpha) demographic (e.g., highlight fast WiFi, smart home features, local guides).
- Highlight unique local experiences or amenities relevant to the primary guest profile.
- Consider seasonal promotions aligned with peak travel times for key origin markets.
Nearby Short-Term Rental Market Comparison
How does the Crac'h Airbnb market stack up against its neighbors? Compare key performance metrics like average monthly revenue, ADR, and occupancy rates in surrounding areas to understand the broader regional STR landscape.
| Market | Active Properties | Monthly Revenue | Daily Rate | Avg. Occupancy |
|---|---|---|---|---|
| Île-de-Bréhat | 46 | $2,254 | $221.52 | 45% |
| Lanmodez | 19 | $2,050 | $219.93 | 42% |
| Île-aux-Moines | 98 | $2,048 | $236.18 | 42% |
| Plouguenast-Langast | 18 | $2,006 | $233.04 | 40% |
| Plélan-le-Petit | 15 | $2,001 | $178.51 | 42% |
| Guern | 13 | $1,802 | $102.72 | 42% |
| Plumaugat | 18 | $1,773 | $272.67 | 29% |
| Caden | 22 | $1,766 | $152.63 | 47% |
| Landaul | 17 | $1,697 | $148.36 | 45% |
| L'Épine | 155 | $1,694 | $158.12 | 45% |